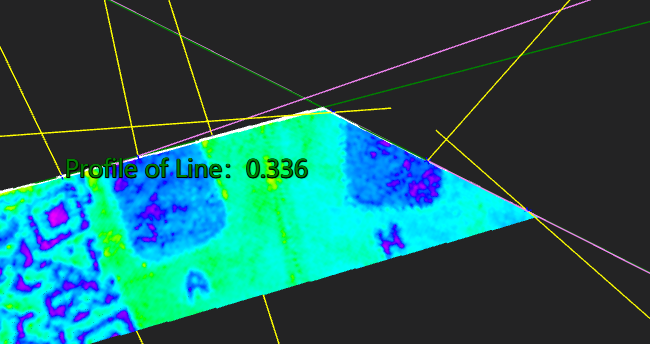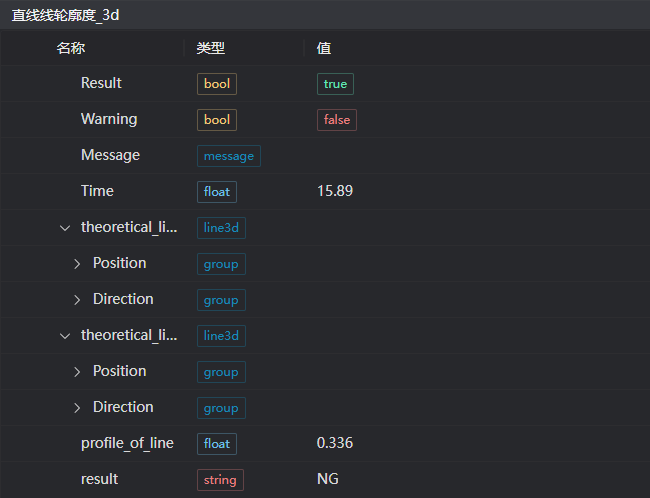
3D Straight-Line Profile
Operator Function
Calculate the geometric tolerance - straight-line profile
This operator has 1D and 3D modes. The 1D mode calculates the profile of a line between one line and a theoretical line; the 3D mode calculates the profile of a line between two lines and two theoretical lines.
As shown in the figure below, compute the distance from the theoretical point to the actual line, denoted as 𝑑1, 𝑑2, …, 𝑑n. The profile of a line is:
2 × 𝑚𝑎𝑥(𝑑1, 𝑑2, …, 𝑑n)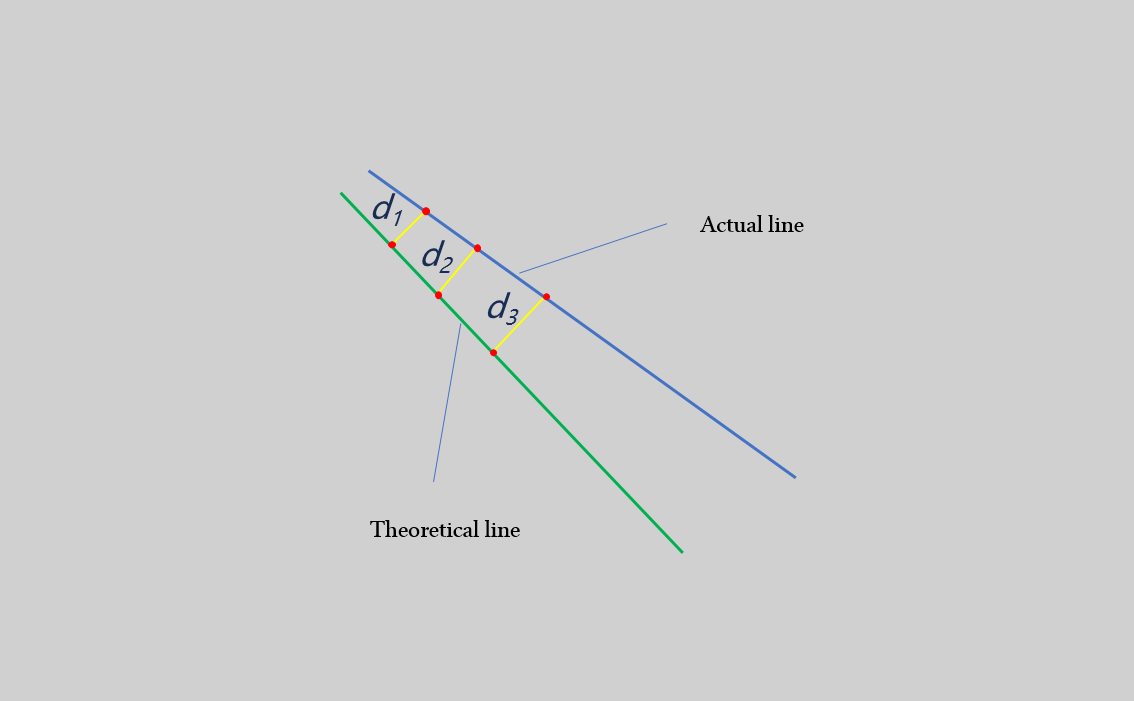
Parameters
Input Parameters

| Parameter | Range | Default | Description | Diagram |
|---|---|---|---|---|
| Input Image | 0-8 | 0 | IM index of the input image | |
Calculation Parameters
1D
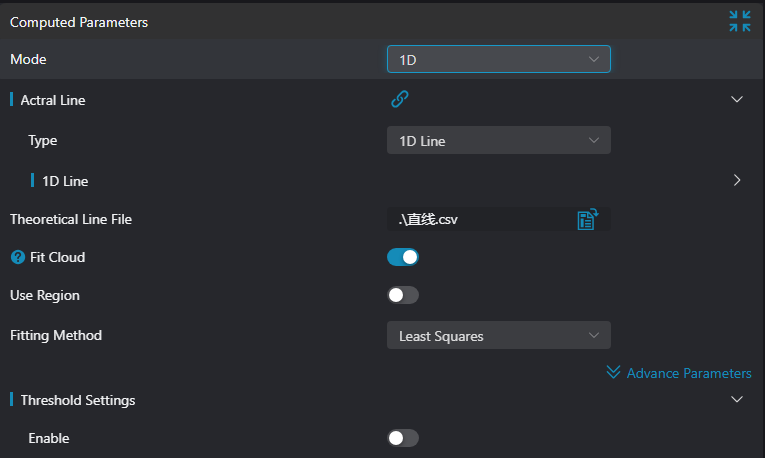
| Parameter | Range | Default | Description | Diagram |
|---|---|---|---|---|
| Actual Line | 1D Line | - | A point on the actual line and its direction vector | |
| Theoretical Line | json file | - | Theoretical line sampling point file | |
| Fit Point Cloud | true/false | false | Translate the theoretical position points to the position of the point cloud enclosed by the most-fitting region selection, so that the measurement value is minimized | |
| Use Region Parameter | true/false | false | When enabled, use Region as input; when disabled, use Input Image as input | |
| Region | 1D Window | 1D Window | Manually select a suitable ROI regionYou can select an existing ROI region by binding | |
| Theoretical Line Fitting Method | Least Squares / RANSAC | - | Select the method for fitting the theoretical line | |
| Distance Threshold | 0.0-50.0 | 0.02 | Select an appropriate distance threshold; increase this parameter when there is more noise, decrease it when there is less noise | |
| Maximum Iterations | 100-10000 | 1000 | Set the maximum number of iterations |
3D
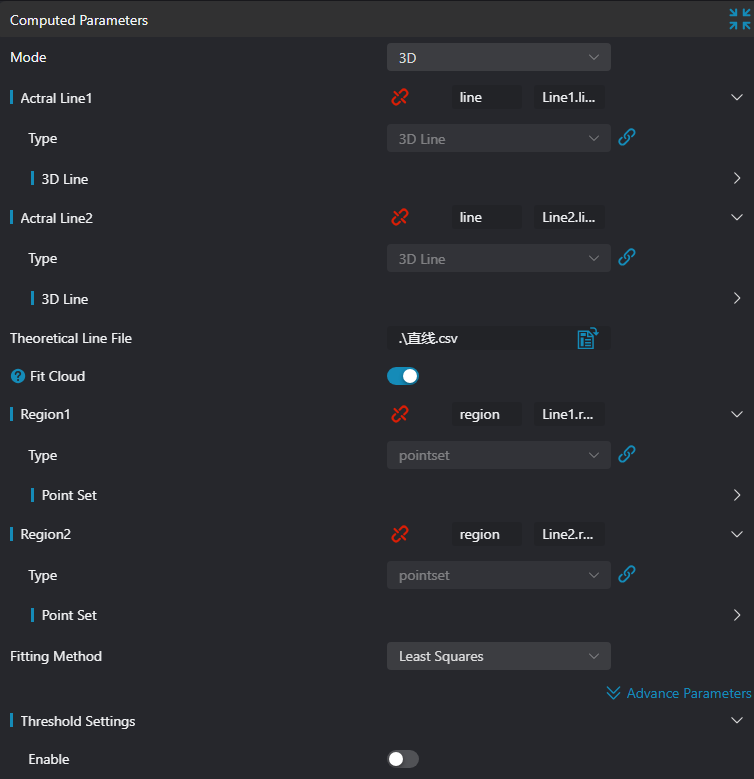
| Parameter | Range | Default | Description | Diagram |
|---|---|---|---|---|
| Actual Line 1 | 3D Line | - | A point on actual line 1 and its direction vector | |
| Actual Line 2 | 3D Line | - | A point on actual line 2 and its direction vector | |
| Theoretical Line | json file | - | Theoretical line sampling point fileIf there are two different lines, place them in the same file | |
| Fit Point Cloud | true/false | false | Translate the theoretical position points to the position of the point cloud enclosed by the most-fitting region selection, so that the measurement value is minimized | |
| Region 1 | 2D Window / 2D Circular Window / 2D Polygon Window / Box / Cylinder Box / Rotated Box / Point Set (binding only) | Box | Manually select a suitable ROI regionYou can select an existing ROI region by binding | |
| Region 2 | 2D Window / 2D Circular Window / 2D Polygon Window / Box / Cylinder Box / Rotated Box / Point Set (binding only) | Box | Manually select a suitable ROI regionYou can select an existing ROI region by binding | |
| Theoretical Line Fitting Method | Least Squares / RANSAC | - | Select the method for fitting the theoretical line | |
| Distance Threshold | 0.0-50.0 | 0.02 | Select an appropriate distance threshold; increase this parameter when there is more noise, decrease it when there is less noise | |
| Maximum Iterations | 100-10000 | 1000 | Set the maximum number of iterations |
Result Display
1D
| Parameter | Range | Default | Description | Diagram |
|---|---|---|---|---|
| Actual Fitted Line | true/false | false | The input actual fitted line; when enabled, displayed on the IM | |
| Theoretical Line | true/false | false | The input theoretical line; when enabled, displayed on the IM | |
| Foot of Perpendicular from Theoretical Line Point to Actual Line | true/false | false | The foot of perpendicular from the input theoretical line point to the actual line; when enabled, displayed on the IM | |
| Line Connecting Theoretical Line Point and Its Foot on Actual Line | true/false | false | The line connecting the input theoretical line point and its foot on the actual line; when enabled, displayed on the IM | |
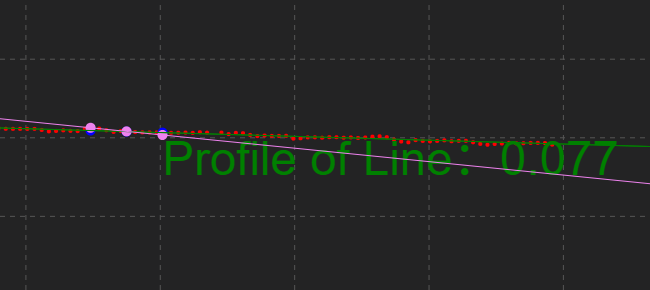
| Profile of a Line | true/false | false | The output profile of a line; when enabled, displayed on the IM |
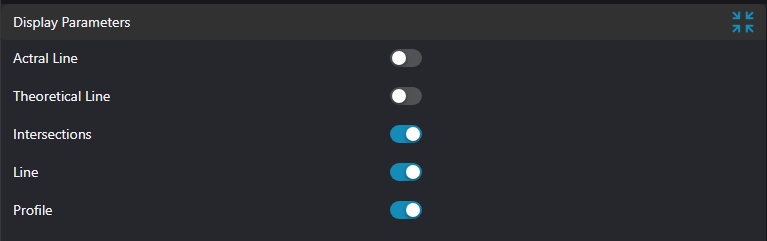
3D
| Parameter | Range | Default | Description | Diagram |
|---|---|---|---|---|
| Actual Fitted Line 1 | true/false | false | The input actual fitted line 1; when enabled, displayed on the IM | |
| Actual Fitted Line 2 | true/false | false | The input actual fitted line 2; when enabled, displayed on the IM | |
| Theoretical Line 1 | true/false | false | The input theoretical line 1; when enabled, displayed on the IM | |
| Theoretical Line 2 | true/false | false | The input theoretical line 2; when enabled, displayed on the IM | |
| Foot of Perpendicular from Theoretical Line Point to Actual Line | true/false | false | Display two sets of points: the input theoretical line points and the feet of perpendicular from the theoretical line points to the actual line; when enabled, displayed on the IM | |
| Line Connecting Theoretical Line Point and Its Foot on Actual Line | true/false | false | The line connecting the input theoretical line point and its foot on the actual line; when enabled, displayed on the IM | |
| Profile of a Line | true/false | false | The output profile of a line; when enabled, displayed on the IM |
Output Parameters
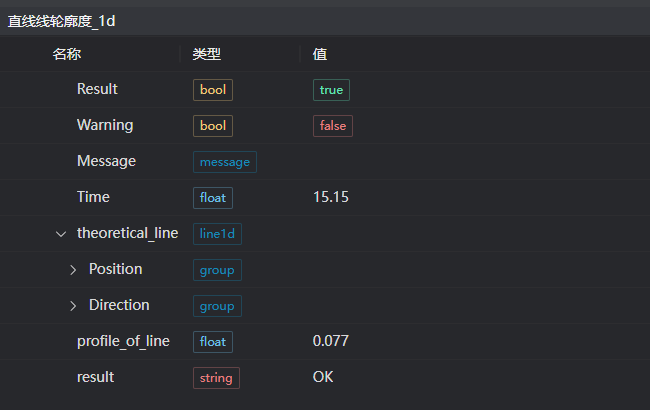
1D
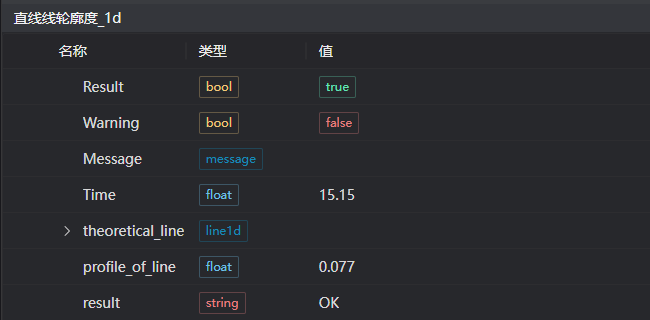
| Name | Type | Range | Description |
|---|---|---|---|
| Result | bool | true/false | true for success false for failure |
| Warning | bool | true/false | true indicates a warning false indicates none |
| Message | string | Output success, error, or warning message; empty if no error or warning | |
| Time | float | Operator execution time, unit: ms | |
| theoretical_line | line1d | Theoretical line | |
| parallelism | float | Profile of a line | |
| result | string | OK/NG | Whether the profile of a line is within range |
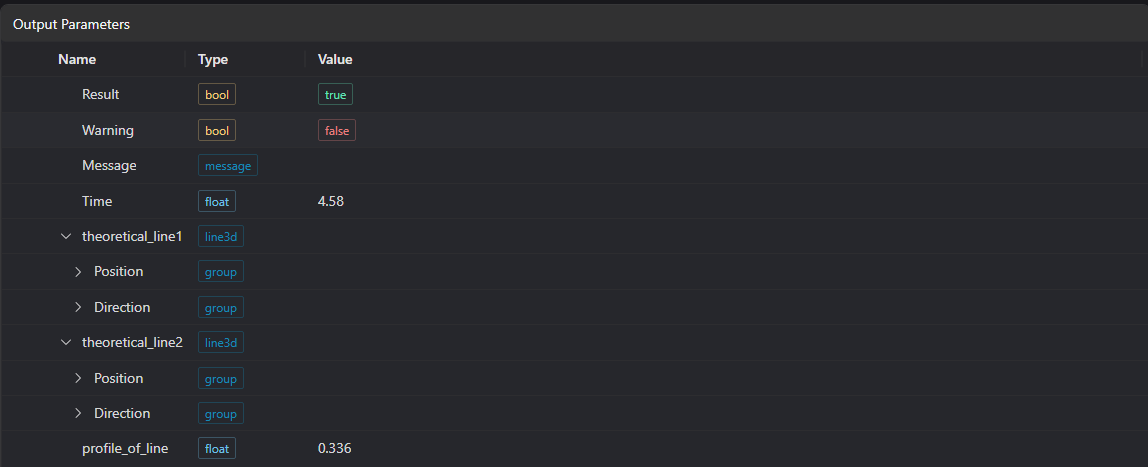
3D
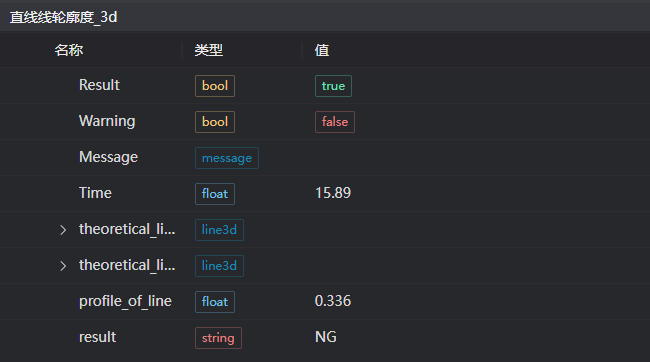
| Name | Type | Range | Description |
|---|---|---|---|
| Result | bool | true/false | true for success false for failure |
| Warning | bool | true/false | true indicates a warning false indicates none |
| Message | string | Output success, error, or warning message; empty if no error or warning | |
| Time | float | Operator execution time, unit: ms | |
| theoretical_line1 | line3d | Theoretical line 1 | |
| theoretical_line2 | line3d | Theoretical line 2 | |
| parallelism | float | Profile of a line | |
| result | string | OK/NG | Whether the profile of a line is within range |
Tip
For more details on parameter types, please refer to Type Definition
Troubleshooting
| No. | Exception Message | Corresponding Parameter | Solution |
|---|---|---|---|
| 1 | The number of input point cloud or profile points is less than 2 | Confirm whether the IM contains at least two valid points. If this condition is not met, load the point cloud or switch to a qualifying IM | |
| 2 | The type of actual line {1} is {0}, an incorrect input type | Line Type, Index | In 1D mode, check whether the line type is a 1D Line; in 3D mode, check whether the line type is a 3D Line |
| 3 | Parameter {0} cannot be empty | Path | Check whether the path is empty |
| 4 | File {0} does not exist or cannot be accessed | Path | Check whether the path is valid |
| 5 | The input theoretical line fitting method is {0}, an invalid fitting method | Fitting Method | Check whether the line fitting method is one of Least Squares / RANSAC |
| 6 | The input theoretical line point cloud is empty | Check whether the theoretical line point json file is empty | |
| 7 | The minimum value of the input profile range is greater than the maximum, an invalid profile range | Set the minimum of the profile range to be less than or equal to the maximum | |
| 8 | The number of theoretical line point cloud points is less than 2 | Check whether the number of input theoretical line point cloud points is less than 2 | |
| 9 | The direction vector of actual line {0} is invalid | Index | Check whether the direction vector of this line is all zeros |
| 10 | The input mode is {0}, an invalid mode | Mode | Check whether the mode is one of 1D / 3D |
| 11 | The input theoretical line point cloud is not a profile point | Check whether a certain row of the theoretical line point cloud has all values equal to a fixed value | |
| 12 | The input region type is {0}, an invalid region type | Region Type | In 1D mode, check whether the region type is a 1D Window; in 3D mode, check whether the region type is one of 2D Window / 2D Circular Window / 2D Polygon Window / Box / Cylinder Box / Rotated Box / Point Set |
| 13 | The number of polygon vertices is less than 3, cannot form a polygon | Add 2D polygon window vertices so that the number of vertices is at least three | |
| 14 | The input region is empty | 1. Check whether the selection is empty 2. Check whether the point set is empty |
Examples
Engineering Setup
Select the
Load Point Cloudtool to load the 3D point cloud to be processed into IM0;Select the
3D Straight-Line Profiletool.
Tool Usage
Select the input image to be operated on; the image index must match the IM index of the image in the project.
Either disable the use-region parameter, or enable the region and select the region type as Box, then move the box to the position to be measured so that it encloses the point cloud to be measured.
Usage Tips
1. Drag or scale the box via the ROI controller on the image window;
2. Directly modify the start or end coordinates of the box in the calculation parameters to adjust the box position and size
Set the parameters.
Check the items to be displayed in the Result Display panel.
Click
Testto check whether the image window and parameters meet expectations.After confirming there are no problems, click
Save, then run the operator in the run list to view the running result in the corresponding IM.
1D
3D