Debug Output Panel
The Debug Output Panel is divided into four parts: Global Variables List (Global Variables), Operator Variables List (Operator Variables), Connected Devices List (Device Status), and Operation Log.
Global Variables
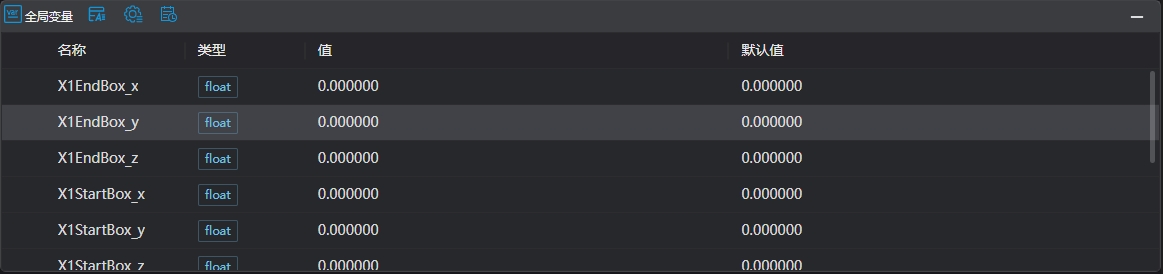
| Name | Type | Range | Description |
|---|---|---|---|
| Name | string | Global variable name | |
| Type | Basic Types | Current variable type, conforming to basic type definitions | |
| Value | Current value of the variable | ||
| Default Value | Value when the variable is reset |
Operator Variables
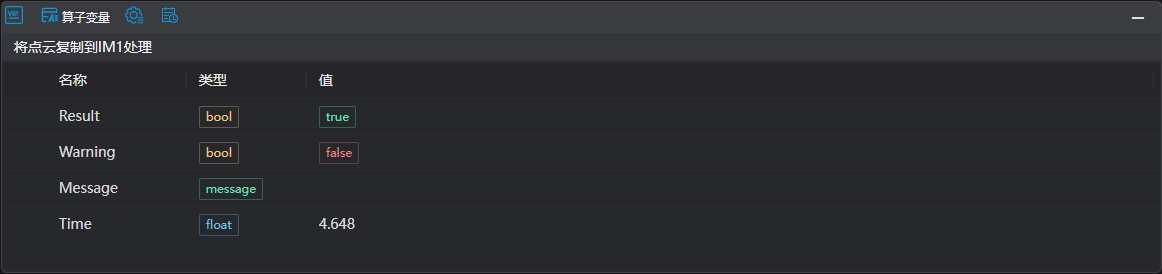 After tools in the program list finish executing, click on a tool row to display the output results of the corresponding tool in this area.
| Name | Type | Range | Description |
|---|---|---|---|
| Tool Name | Current name of the operatorThis field is empty when clicking on blank areas or non-executed tools | ||
| Result | bool | true/false | Tool execution result, true for OK, false for NG |
| Warning | bool | true/false | Indicates whether there are WARNs during tool execution, true if present, false if not |
| Message | message | Prompt information returned by the tool when Result is not OKIf multiple messages exist, they are returned as an array | |
| Time | float | Time consumed for one tool execution, unit: ms | |
| Others | Non-fixed return content, please refer to the tool's return description, Tool Introduction |
Device Status
| Name | Image | Description |
|---|---|---|
| Device Status | 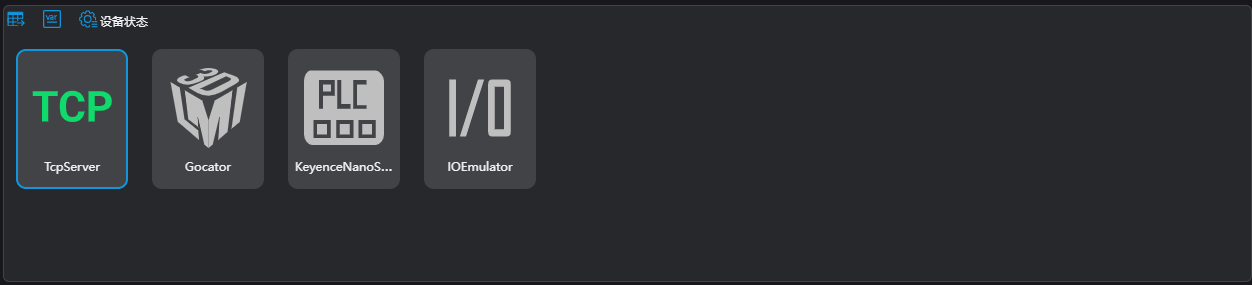 | Displays the status of devices configured in the current project, colored indicates device is connected, gray indicates device is not connected |
Log Management

| Name | Type | Range | Description |
|---|---|---|---|
| Time | time | Time when this log entry was generated | |
| Level | info/warn/error | Log levelNote: Debug level logs are not displayed here, they are directly saved in the software's log file | |
| Content | Specific content of the log |